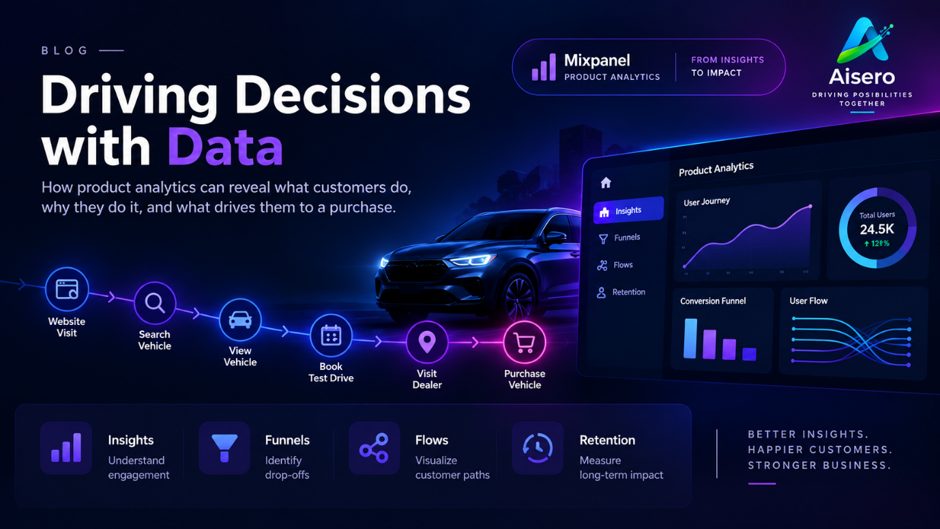
Understanding customer behavior isn't limited to knowing how many people visit a website or how many products are purchased. Businesses also need to understand what customers do before a conversion, where they lose interest, and how they move through the complete customer journey. This is the story of how I used Mixpanel to turn a large automotive company's raw customer interactions into a complete, data-driven view of the vehicle purchase journey.
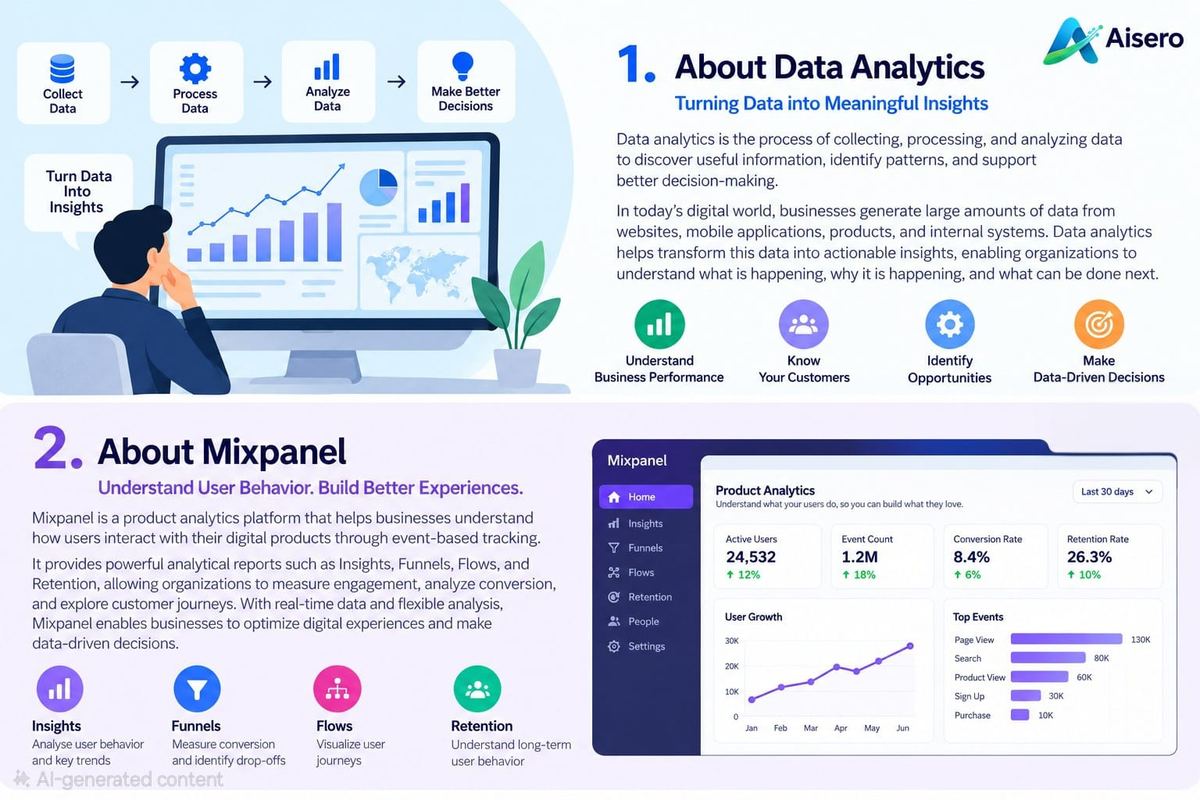
About Data Analytics
Turning Data into Meaningful Business Insights
Data analytics is the process of collecting, organizing, analyzing, and interpreting data to identify meaningful patterns and support better decision-making. Today, businesses generate large amounts of data through websites, mobile applications, digital campaigns, customer interactions, transactions, and other business activities. However, simply collecting this data is not enough — the real value comes from understanding what the data tells us.
For example, imagine a large automotive company with thousands of customers visiting its website every day. Simply knowing that 10,000 people visited the website provides only limited information. Data analytics can help the company answer deeper questions:
- How many customers searched for a vehicle?
- Which vehicle models received the most interest?
- How many customers viewed vehicle details?
- How many booked a test drive?
- Where did potential customers leave the purchase journey?
- Which customer groups were more likely to make a purchase?
- Which regions generated stronger sales?
- What customer preferences influenced purchasing decisions?
By analyzing this information, businesses can move beyond raw numbers and gain a clearer understanding of customer behavior and business performance.
From Data to Decisions
The goal of data analytics is to transform information into insights that can support meaningful business decisions:
Raw Data → Analysis → Insights → Better Business Decisions
For an automotive business, this could mean identifying where customers lose interest, understanding which vehicles are most popular, improving the digital customer experience, or finding opportunities to increase conversions. Ultimately, data analytics helps organizations understand what is happening, why it is happening, and where improvements can be made.
About Mixpanel
Understanding Customer Behavior Through Events
Mixpanel is a product analytics platform that helps businesses understand how users interact with their digital products and services. It works primarily through event-based tracking — an event represents a meaningful action performed by a user.
For example, consider the digital journey of a customer visiting the website of a large automotive company:
Website Visit → Search Vehicle → View Vehicle Details → Book Test Drive → Visit Dealer → Purchase Vehicle
Each of these actions can be captured as an event and analyzed to better understand customer behavior — answering questions such as which actions customers perform most frequently, where they lose interest and leave the journey, how many users move from one stage to the next, which journeys are more likely to result in a purchase, and how behavior changes over time.
How Mixpanel Helps Analyze Customer Behavior
Mixpanel provides different types of reports to analyze customer behavior from multiple perspectives:
- Insights — help businesses analyze trends and measure customer engagement, showing how frequently customers interact with different stages of a digital journey.
- Funnels — help measure how customers progress through a defined sequence of events and identify where the largest drop-offs occur.
- Flows — help visualize the different paths customers actually take. Unlike a predefined funnel, a flow can reveal unexpected navigation patterns and actions customers may skip.
- Retention — helps businesses understand how customer behavior changes over time and whether specific interactions are associated with continued engagement or conversion.
Together, these capabilities help businesses transform individual customer interactions into meaningful insights:
Customer Interaction → Events Captured → Behavior Analysis → Reports & Dashboards → Business Insights → Data-Driven Decisions
By understanding how customers interact with a digital platform, businesses can identify friction points, improve customer experiences, optimize conversion journeys, and make more informed decisions.
Use Cases — Why I Used Mixpanel
Understanding customer behavior is not limited to knowing how many people visit a website or how many products are purchased. Businesses also need to understand what customers do before a conversion, where they lose interest, and how they move through the complete customer journey. Consider the journey of a customer exploring a vehicle online:
Website Visit → Search Vehicle → Vehicle View → Test Drive Booked → Dealer Visit → Vehicle Purchased
Each stage represents an important customer interaction. However, simply capturing these interactions does not automatically provide a clear understanding of customer behavior. This leads to an important business challenge.
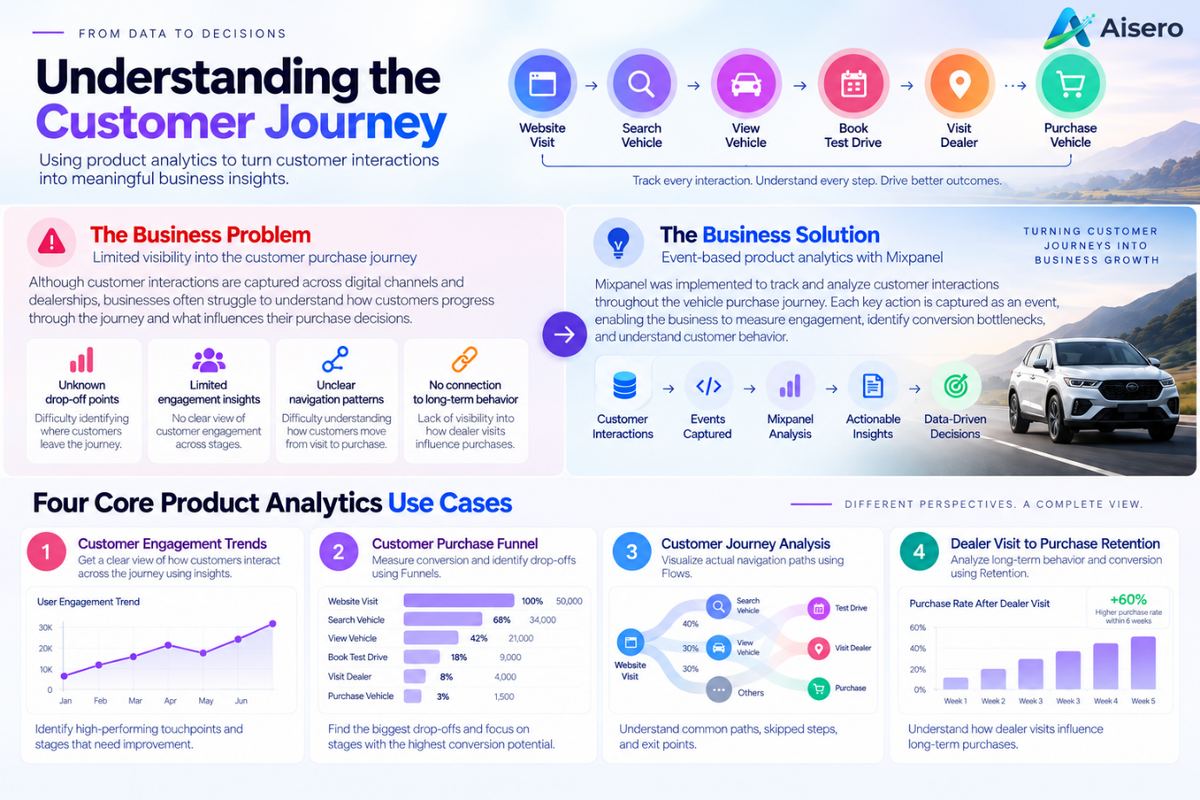
The Business Problem
Before implementing product analytics, an automotive business may have thousands of customer interactions across its website, digital platforms, and dealer network. Although these interactions are being captured, the business may still lack a complete understanding of how customers progress through the purchase journey. For example, the business may know how many vehicles were purchased, but it may not know:
- Where customers dropped off before completing a purchase
- Which stages generated the highest or lowest engagement
- How customers navigated from their first website interaction toward a purchase
- Whether customers followed the expected journey or took different paths
- How interactions such as dealer visits influenced eventual purchases
- Which customer behaviors could be optimized to improve conversion
As a result, it becomes difficult to identify conversion bottlenecks, understand customer behavior, and make data-driven improvements to the overall customer experience.
The Business Solution
To address these challenges, I used Mixpanel to track and analyze meaningful customer interactions throughout the purchase journey. Each important customer action was treated as an event, allowing the complete journey to be analyzed from the initial website visit to the final vehicle purchase. The overall process can be represented as:
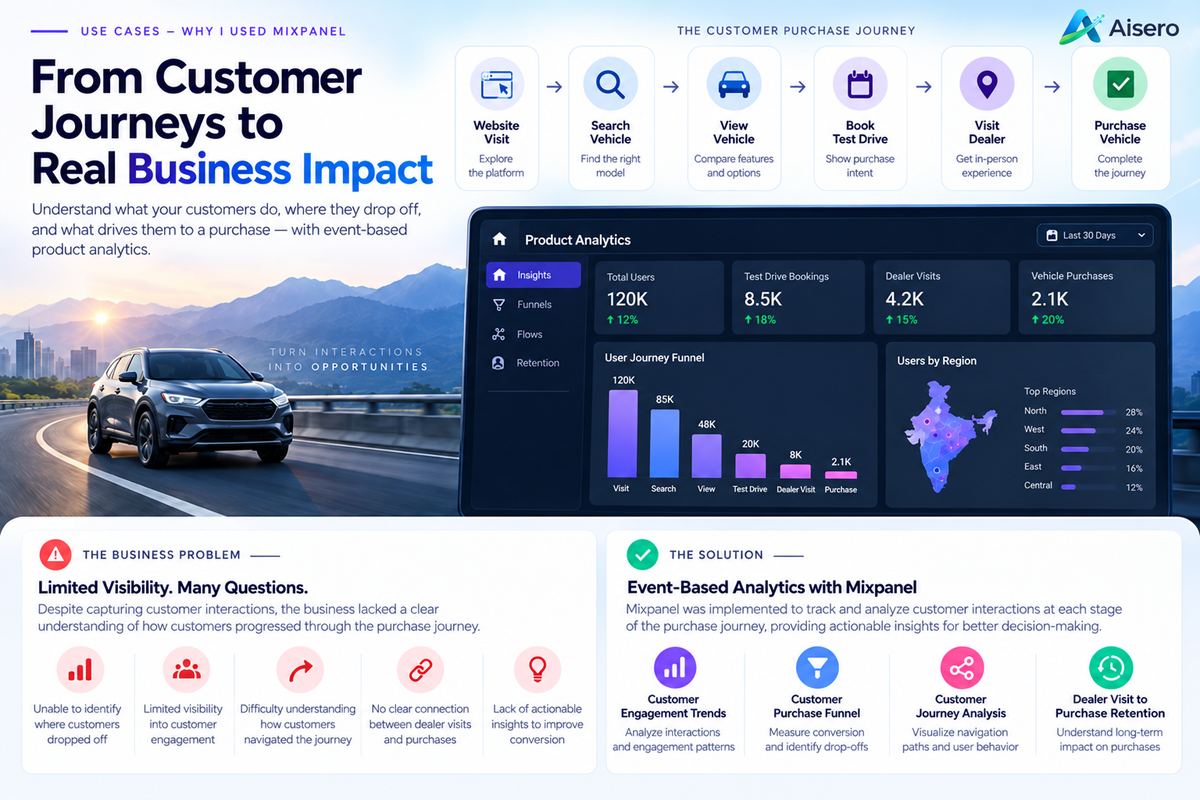
Customer Interaction → Events Captured → Mixpanel Analysis → Business Insights → Data-Driven Decisions
Using Mixpanel, I built the solution around four core product analytics use cases. Each use case focuses on a different aspect of customer behavior.
The Four Core Product Analytics Use Cases
1. Customer Engagement Trends — Insights. This use case focuses on understanding how customers interact with different stages of the platform and how engagement changes throughout the journey. Using Mixpanel Insights, the analysis can help answer how many customers are interacting with the platform, which stages receive the highest engagement, how engagement changes over time, and at which point engagement begins to decline. This helps identify high-performing touchpoints and areas that may require improvement.
2. Customer Purchase Funnel — Funnels. This use case focuses on measuring how successfully customers progress from one stage of the journey to the next, following the customer journey from website visit through to vehicle purchased. Using Mixpanel Funnels, the analysis can identify where customers drop off, which stage has the lowest conversion rate, how many customers progress through each stage, and which stages should be prioritized for optimization.
3. Customer Journey Analysis — Flows. Not every customer follows the same path. While a funnel analyzes a predefined journey, Mixpanel Flows help visualize the actual paths customers take — identifying the most common customer journeys, steps customers frequently skip, where customers exit the journey, and which paths are associated with stronger conversion.
4. Dealer Visit to Vehicle Purchase Retention — Retention. Some important customer interactions may not result in an immediate purchase — a customer may visit a dealer but complete a purchase at a later point. Using Mixpanel Retention, the analysis can explore what percentage of customers who visit a dealer eventually make a purchase, how purchase behavior varies across customer segments, which vehicle models demonstrate stronger conversion behavior, and how behavior differs across geographic regions.
Why These Four Use Cases Work Together
The four use cases provide different perspectives on the same customer journey:
| Use Case | Mixpanel Capability | What It Helps Understand |
|---|---|---|
| Customer Engagement Trends | Insights | Customer engagement and interaction patterns |
| Customer Purchase Funnel | Funnels | Conversion and customer drop-offs |
| Customer Journey Analysis | Flows | Actual customer navigation paths |
| Dealer Visit to Vehicle Purchase Retention | Retention | Long-term customer behavior and conversion |
Together, these analyses provide a more complete view of the customer journey — from initial engagement to eventual purchase.
Use Case Showcase — What We Built
After identifying the key business questions and defining the role of Mixpanel, I built a product analytics solution to analyze the complete vehicle purchase journey.
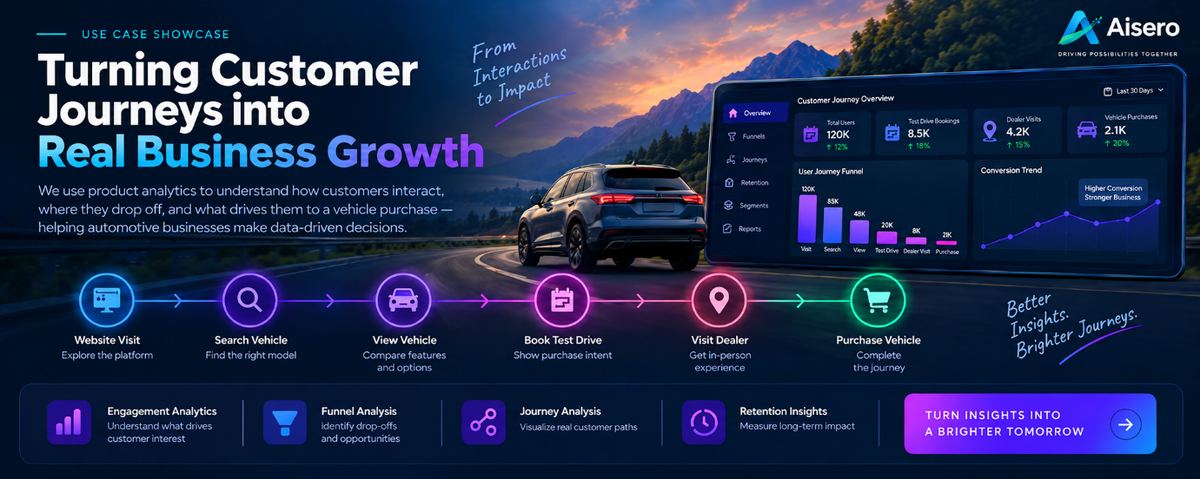
The objective was to understand how customers interact with the digital platform, how they progress toward a purchase, where they drop off, and which interactions are most closely associated with conversion.
The customer journey analyzed in this implementation was: Website Visit → Search Vehicle → Vehicle View → Test Drive Booked → Dealer Visit → Vehicle Purchased. Each stage represents a meaningful customer interaction. By tracking these events and analyzing them through Mixpanel, I created four core analytical use cases combining Insights, Funnels, Flows, and Retention to provide different perspectives on customer behavior throughout the purchase journey.
1. Customer Engagement Trends
The Objective: understand how customers engage with the platform at different stages of their purchase journey. Rather than looking only at the final purchase, this analysis examines customer activity throughout the journey and identifies how engagement changes as customers move from one stage to another.
Questions I Analyzed
- How many customers visit the website?
- Which stage receives the highest customer engagement?
- How does engagement change over time?
- At which stage does customer engagement decline the most?
What the Analysis Revealed: in this implementation, website visits reached 120K unique users, dropping to 86K for vehicle search, 48K for vehicle views, 20K test drive bookings, 8K dealer visits, and 2K completed purchases. Key observations:
- Website visits represent the highest level of customer engagement.
- Customer engagement gradually decreases as users move further through the purchase journey.
- Test drive bookings indicate stronger purchase intent.
- Engagement trends can help evaluate customer acquisition and marketing efforts.
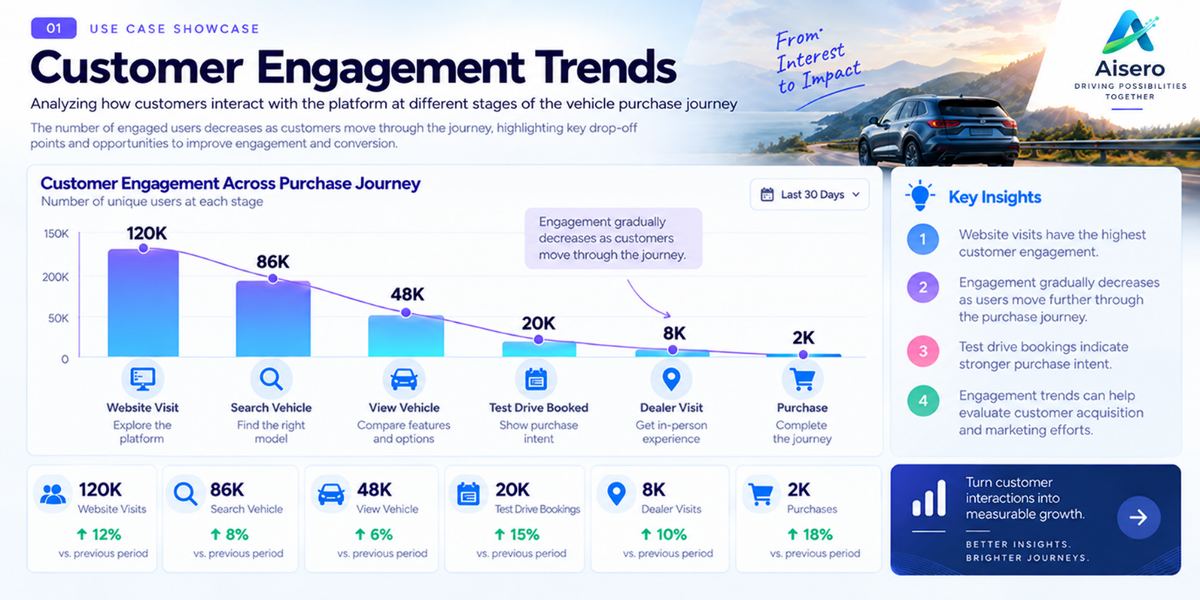
Business Value: understanding engagement trends allows businesses to identify high-performing and low-performing touchpoints. These insights can then be used to improve the digital experience, optimize marketing efforts, and create opportunities for stronger customer engagement.
2. Customer Purchase Funnel
The Objective: analyze how customers progress through the purchase journey and identify where they drop off before completing a purchase. A funnel was created using the key events in the customer journey — Website Visit → Search Vehicle → Vehicle View → Test Drive Booked → Dealer Visit → Vehicle Purchased — with each stage representing a step toward conversion.
Questions I Analyzed
- Where do customers drop off during the purchase journey?
- Which funnel stage has the lowest conversion rate?
- What percentage of website visitors eventually complete a purchase?
- Which stage should be prioritized for optimization?
What the Analysis Revealed: the funnel converted from 120,000 website visits (100%) down to just 2,000 purchases — an overall conversion rate of 1.7%. The largest single drop-off (58%) occurred after vehicle view, and 28% of users dropped off right after the website visit stage. Key observations:
- The analysis highlights significant drop-off points across the journey, particularly during the transition from vehicle exploration to higher-intent actions such as test-drive bookings and purchases.
- Customers who book a test drive show stronger purchase intent.
- Even small improvements at high-drop-off stages can have a significant impact on overall conversion.
- Funnel analysis highlights the stages that can have the greatest impact on sales performance.
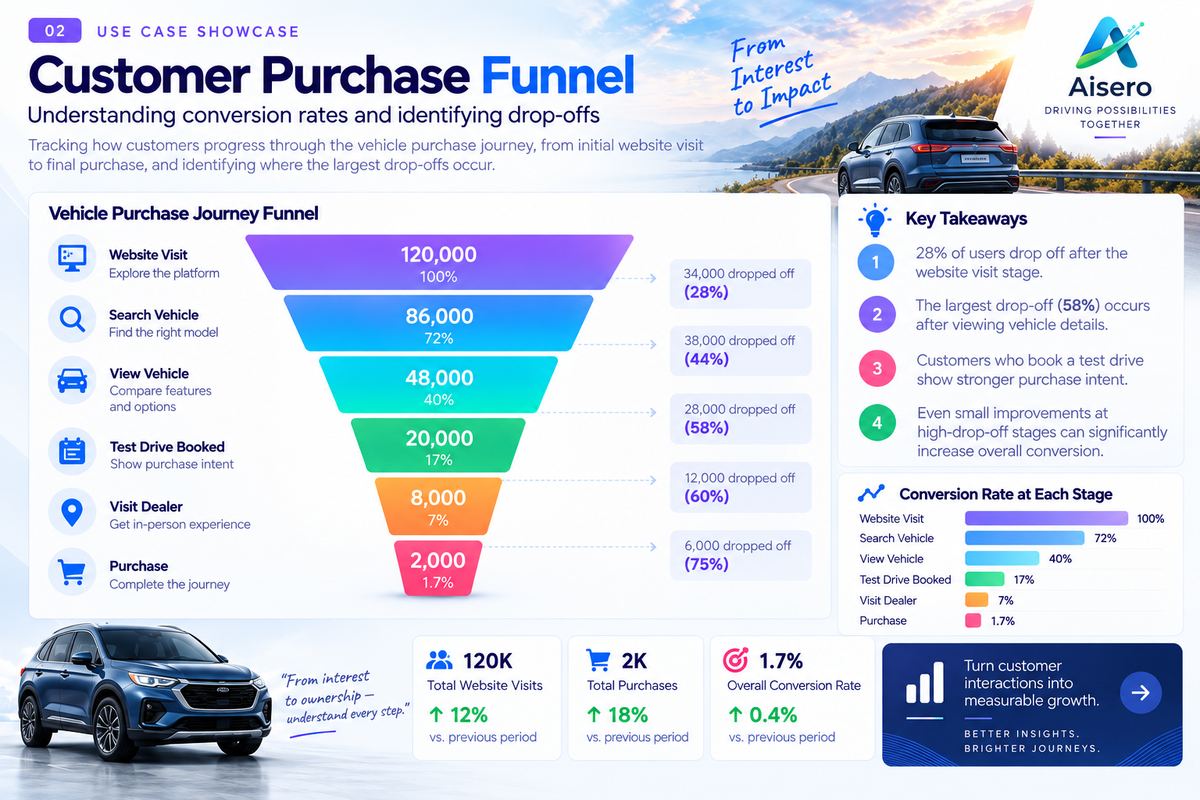
Business Value: instead of making improvements based on assumptions, businesses can use funnel data to identify exactly where customers are leaving the journey. This allows teams to prioritize improvements, reduce abandonment, and create a smoother path toward conversion.
3. Customer Journey Analysis
The Objective: understand the actual paths customers take before completing a purchase. A funnel follows a predefined sequence, but real customer behavior is often more complex — customers may skip steps, repeat actions, or follow completely different paths before making a decision.
Questions I Analyzed
- What is the most common journey leading to a purchase?
- Which events are frequently skipped?
- At which stage do customers most commonly exit?
- Which navigation paths result in stronger conversion?
What the Analysis Revealed: customers do not always follow a single, fixed journey. Some follow the complete path — Website → Search → Vehicle View → Test Drive → Dealer Visit → Purchase — while others take a shorter route or skip certain intermediate stages (for example, 15% of visitors skip search and jump directly to viewing a vehicle). Across more than 12 unique journey paths identified, 38% of users exited before completing a purchase. The analysis helps identify:
- Common customer journeys
- Frequently skipped steps
- Exit points
- Successful paths associated with stronger conversion
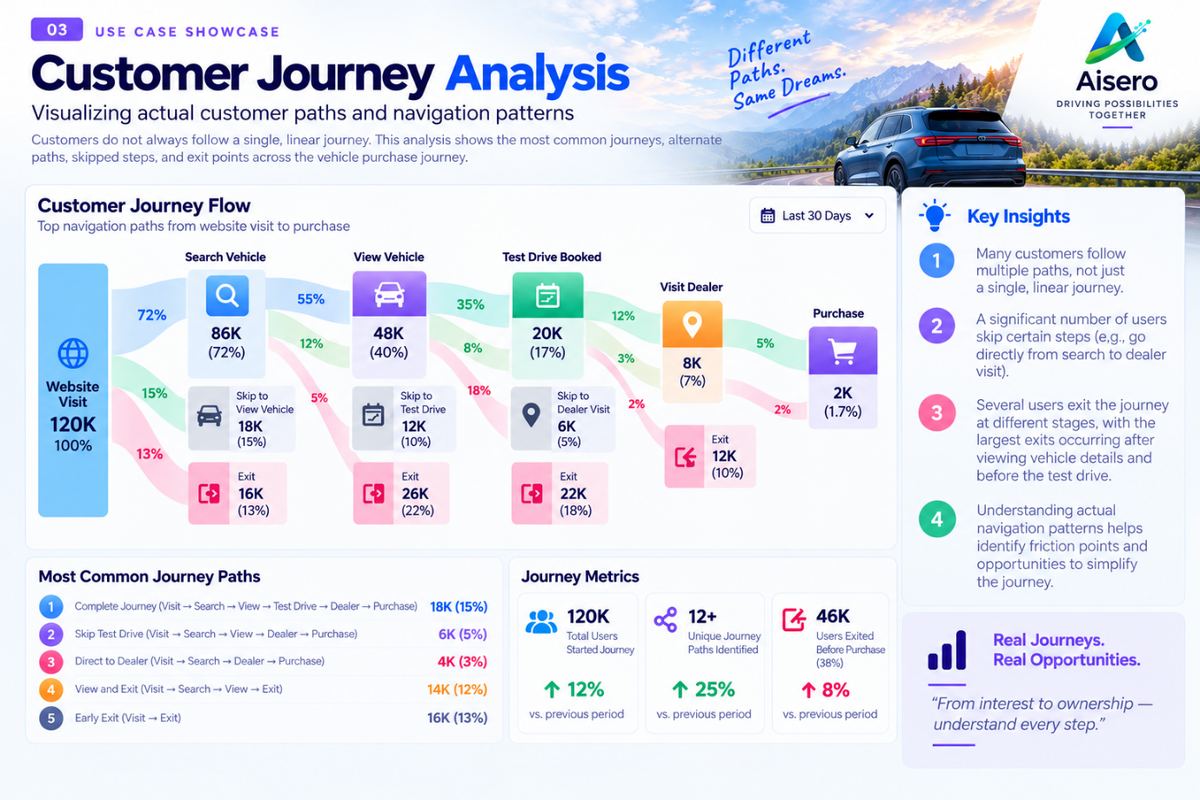
Business Value: understanding actual customer behavior helps businesses identify friction points and unnecessary steps in the journey. These insights can be used to simplify navigation, improve the customer experience, and make the conversion journey more efficient.
4. Dealer Visit to Purchase Retention Analysis
The Objective: understand how an important customer interaction, such as a dealer visit, influences purchase behavior over time. A customer may visit a dealer but not immediately purchase a vehicle, so looking only at immediate conversions does not provide the complete picture.
Questions I Analyzed
- What percentage of customers who visit a dealer eventually make a purchase?
- Which vehicle models demonstrate stronger purchase retention?
- Which customer segments show stronger long-term conversion potential?
- Which regions demonstrate stronger dealer-to-purchase conversion?
What the Analysis Revealed: purchase retention after a dealer visit climbed steadily over time — 12% within 7 days, 28% within 14 days, 52% within 30 days, 68% within 60 days, and 84% within 90+ days. Customers who visit a dealer were 2.3x more likely to purchase than those who don't. Retention also varied by vehicle model (88% down to 70%), by customer segment (repeat customers highest at 84%, corporate buyers lowest at 68%), and by region (North highest at 82%, East lowest at 70%). Key observations:
- Customers who visit a dealer are more likely to eventually complete a purchase.
- Purchase behavior varies across vehicle models and customer segments.
- Geographic analysis can reveal regions with stronger dealer-to-purchase conversion.
- Retention analysis helps identify customer groups with stronger long-term purchase potential.
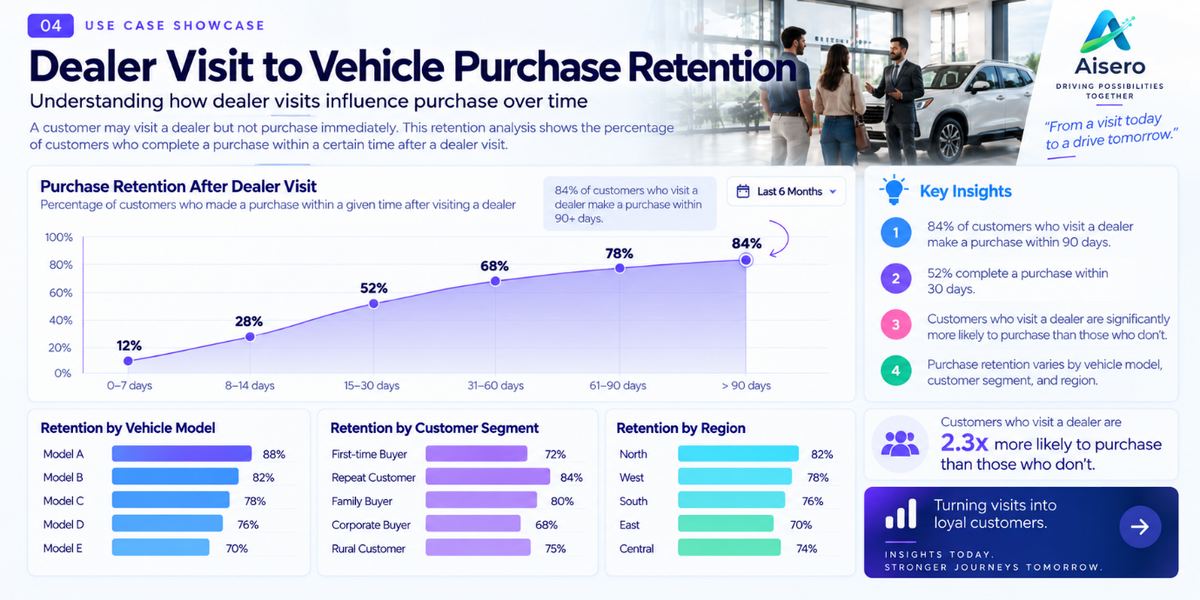
Business Value: these insights can help businesses evaluate the effectiveness of important customer interactions, identify stronger customer segments and regions, and improve strategies for supporting customers throughout the longer purchase cycle.
How Aisero Can Help Turn Customer Data into Action
Every business generates valuable customer and operational data, but collecting data alone is not enough. The real value comes from understanding that data and using it to make better decisions. At Aisero, we help organizations transform raw data into meaningful insights through analytics and visualization solutions. Our approach can include:
- Product Analytics and Customer Journey Analysis — understanding how users interact with digital platforms and identifying important behavioral patterns.
- Mixpanel Implementation and Analytics — setting up meaningful events, analyzing funnels, customer flows, retention, and conversion behavior.
- KPI Dashboards and Reporting — creating clear dashboards that make important business metrics easier to monitor and understand.
- Interactive Data Visualization — transforming complex data into visual insights that support faster decision-making.
- Business Intelligence Solutions — connecting and analyzing relevant business data to uncover trends, opportunities, and areas for improvement.
The work demonstrated in this use case shows how customer interaction data can be structured and analyzed across the complete journey — from initial engagement to conversion. By applying the right analytics approach, organizations can better understand customer behavior, identify friction points, measure conversion performance, and discover opportunities for improvement.
If your organization has customer, product, or business data but needs help turning it into actionable insights, Aisero can help you build the analytics foundation needed to support better decisions and measurable business growth.
Turn Your Data into Actionable Insights with Aisero
Ready to turn your data into actionable insights? Our team can help you build the right analytics foundation for better decisions and measurable business growth.
Get in Touch